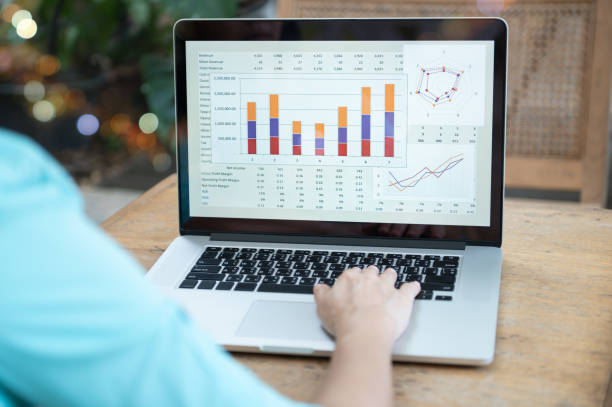
Businesses generate large amounts of data through their daily operations. Sales figures, marketing performance, customer information, financial results, website activity, and operational metrics can all provide valuable insights. However, having access to large volumes of information does not automatically make it easy to understand.
When data is spread across different systems or presented through generic reports, important information can be difficult to find. A custom dashboard can help solve this challenge by presenting relevant information in a centralised and visual format. Instead of forcing every team to work with the same standard reports, businesses can create dashboards around their specific goals, metrics, and reporting requirements.
What Is a Custom Dashboard?
A custom dashboard is a reporting interface designed around the specific needs of a business, department, team, or project. Unlike a standard dashboard with predefined metrics, a custom dashboard can be configured to display the information that matters most to its users.
For example, a marketing team may need to monitor website traffic, leads, conversions, and campaign performance, while a finance team may focus on revenue, expenses, cash flow, and profitability.
A well-designed dashboard can combine data from multiple sources and present it through:
- Charts and graphs
- Tables
- KPI indicators
- Performance comparisons
- Trend reports
- Filters
- Interactive visualisations
The objective is to make important data easier to access, understand, and act upon.
Why Traditional Reporting Can Be Challenging
Traditional reporting methods often involve spreadsheets, manually prepared documents, and information collected from several platforms. While these methods can work for smaller reporting requirements, they can become difficult to manage as a business grows.
Common challenges include:
- Spending too much time preparing reports
- Manually combining information from different sources
- Difficulty identifying important trends
- Repetitive reporting tasks
- Inconsistent data presentation
- Limited visibility into current performance
- Difficulty comparing different periods or departments
These challenges can reduce the amount of time teams have available for actual analysis and decision-making.
How a Custom Dashboard Improves Reporting
1. Centralises Important Information
One of the main advantages of a custom dashboard is that it can bring relevant data together in one location.
Instead of opening multiple spreadsheets or platforms, users can access key performance information through a single reporting interface. This can make routine reporting more efficient and reduce the effort involved in collecting information.
Centralised reporting can also make it easier for different departments to work from consistent information.
2. Reduces Manual Reporting Work
Creating recurring reports manually can take considerable time. Employees may need to collect information, copy figures into spreadsheets, calculate metrics, create charts, and format documents.
A custom dashboard can automate much of this process when it is connected to appropriate data sources.
This allows teams to spend less time preparing reports and more time interpreting the results.
3. Presents Data in a More Useful Format
Raw data can be difficult to interpret, particularly when there are thousands of individual records. A dashboard can transform important information into visual formats that make patterns easier to recognise.
For example, line charts can show changes over time, while bar charts can compare performance across departments or campaigns.
Clear visualisation can help users quickly identify:
- Increases or decreases in performance
- Significant changes
- Underperforming areas
- Progress towards targets
- Differences between business units
Improving Data Analysis
Reporting explains what has happened, while data analysis can help businesses understand why it happened and what should happen next. A custom dashboard can support this process by making relevant information easier to explore.
4. Tracks Relevant KPIs
Different businesses have different objectives, so not every metric is equally useful.
A custom dashboard allows businesses to prioritise KPIs that directly relate to their goals. Depending on the organisation, these might include:
- Revenue
- Profit margins
- Conversion rates
- Customer acquisition costs
- Sales volume
- Customer retention
- Website traffic
- Operational efficiency
- Employee productivity
Focusing on relevant KPIs helps users avoid unnecessary information and concentrate on metrics that support decision-making.
5. Makes Trends Easier to Identify
A single data point rarely provides enough information to understand overall performance. Trends can reveal whether a result represents normal variation or a longer-term change.
A dashboard can compare data across different time periods, such as:
- Daily results
- Weekly performance
- Monthly figures
- Quarterly results
- Year-over-year changes
For example, if sales have gradually declined over several months, the trend may require more attention than a single month with lower results.
6. Allows Data Filtering and Segmentation
Different users may need to examine the same data from different perspectives.
Custom dashboards can include filters that allow users to analyse information by factors such as location, department, product, customer segment, campaign, or time period.
This can help answer more specific questions.
For example, instead of simply asking whether sales increased, a manager may want to know which region, product category, or customer segment contributed to the increase.
Supporting Better Business Decisions
One of the most important benefits of improved reporting and analysis is better decision-making.
When decision-makers have access to relevant and clearly presented information, they can evaluate situations more effectively.
Identifying Performance Gaps
A dashboard can compare actual results against targets or benchmarks. If a department is consistently below its target, managers can investigate the reasons behind the gap.
This creates an opportunity to address problems before they become more significant.
Finding Opportunities
Dashboards are not only useful for identifying problems. They can also reveal areas of strong performance.
For example, data may show that a particular product, customer segment, or marketing channel is producing better results than others. Businesses can use these insights to determine where additional resources may create value.
Improving Collaboration Between Teams
Different departments often use different reporting methods, which can make it difficult to maintain a consistent view of business performance.
A shared dashboard can provide teams with a common source of information. Marketing, sales, finance, and management teams can access relevant metrics while working from consistent data.
This can improve communication and reduce disagreements caused by different reporting methods or outdated figures.
Improving Reporting Accuracy
Manual data handling can introduce errors. Incorrect formulas, duplicated records, outdated information, or simple copy-and-paste mistakes can affect report accuracy.
Automated data connections and consistent calculations can reduce some of these risks.
However, dashboard accuracy still depends on the quality of the underlying data. Businesses should establish appropriate processes for maintaining data quality and ensuring that metrics are defined consistently.

What Should a Custom Dashboard Include?
The right features depend on the business and its objectives. However, a useful dashboard may include:
Clear KPI Overview
Important metrics should be immediately visible so users can understand current performance quickly.
Historical Comparisons
Comparing current figures with previous periods provides useful context.
Interactive Filters
Filters allow users to examine specific categories, departments, locations, or time periods.
Visual Reports
Charts and graphs can make complex information easier to interpret.
Automated Updates
Where appropriate, automated data updates can help ensure users are working with current information.
Actionable Insights
The dashboard should focus on information that can support practical decisions rather than simply displaying large amounts of data.
Best Practices for Creating a Custom Dashboard
A dashboard should be designed around the people who will actually use it. Before creating one, businesses should identify their reporting objectives and determine which questions the dashboard needs to answer.
It is also important to avoid overcrowding the interface with unnecessary metrics. Too much information can make a dashboard difficult to understand.
A strong approach is to:
- Define clear business objectives.
- Identify the most important KPIs.
- Determine which data sources are required.
- Organise information logically.
- Use appropriate visualisations.
- Include useful filters and comparisons.
- Review the dashboard regularly.
- Remove metrics that no longer provide value.
Conclusion
A custom dashboard can significantly improve reporting and data analysis by bringing relevant information together, reducing manual reporting work, and presenting complex data in a more accessible format. It can help businesses track KPIs, identify trends, analyse performance gaps, and discover new opportunities.
The most effective dashboard is not necessarily the one with the largest number of charts or metrics. It is the one that provides the right information to the right people in a clear and useful format.
By designing reporting around specific business objectives, organisations can turn raw data into meaningful insights and use those insights to support more informed, efficient, and strategic decisions.
